Title: CubeTrace: Microscopic Network Tracing for Heterogeneous Cloud Gateways
Authors: Yunming Xiao (The Chinese University of Hong Kong, Shenzhen); Yinchao Yang, Xuqian Li, Dongbo Gu, Jun Zhang, Miantao Wan, Chao Pei (Tencent); Jiaqi Zheng, Chen Tian (Nanjing University); Mingwei Xu (Tsinghua University); Ang Chen (University of Michigan); Congcong Miao (National University of Singapore)
Scribe: Mengqi Fu (Xiamen University)
Introduction
Modern cloud gateways often comprise DPDK servers, programmable switches, and FPGAs, with functions such as routing, load balancing, ACL, and SNAT chained across them. Conventional tools such as traceroute and INT generally expose only devices or hop-level paths; they cannot answer which specific function, table, or FPGA module caused a packet loss or latency spike. Nor can host-side function tracing be transferred directly to switches and FPGAs, which have difficulty maintaining per-packet state, recording per-packet logs, or generating precise timestamps. CubeTrace addresses this need for fine-grained observability inside heterogeneous cloud gateways without turning tracing itself into a data-plane performance burden.
Key Idea and Contributions
CubeTrace makes a central trade-off: rather than recovering the complete execution history of every packet, it aggregates function visit counts and processing latency at flow granularity, then reconstructs paths when the resulting data is decodable. The paper develops four main designs and contributions around this idea:
-
A cube abstraction that unifies tracing objects across heterogeneous hardware. A cube is a common logical observation unit across three platforms: a software function in DPDK, a match-action table or pipeline stage in a programmable switch, or a hardware module in an FPGA. A tracing rule may match a five-tuple flow or a coarser traffic set such as a destination prefix. The different platforms can therefore share the same flow-cube data model instead of requiring separate diagnostic languages.
-
Flow-level aggregation instead of per-packet tracing. Each cube aggregates packet and byte counts and the minimum, average, and maximum processing latency for every tracing rule. Counter differences between adjacent cubes can localize packet drops, while aggregated latency can identify slow functions. The system neither carries a complete path in each packet nor mirrors every packet to the analysis backend. The controller assigns a trace ID to each rule; the corresponding packet field is written at ingress and restored at egress. Because this ID is only an aggregation key and does not encode a packet’s execution history, rule updates do not invalidate traces for packets already in flight.
-
Detection and removal of path ambiguity introduced by flow-level aggregation. After aggregation, the same set of cube visit counts may correspond to multiple sets of edge visit counts, preventing a unique determination of the path or drop location. The paper transforms the tracing graph into a bipartite directed graph and uses DFS/cycle detection to find a particular class of alternating cycles; the presence of such a cycle means that the graph cannot be uniquely decoded. Before deployment, the system inserts a small number of additional cubes according to the detection results until the graph is ambiguity-free. It can then decode the flow-cube statistics into a dynamic call graph or trace tree.
-
Integration with existing analysis tools and deployment in a production gateway. CubeTrace output can be converted into call graphs, trace trees, and flame graphs familiar to distributed tracing systems, allowing existing visualization and analysis capabilities to be reused. The authors have deployed the system in a production cloud gateway containing more than 300 cubes across the software slow path, the switch fast path, and FPGA extension modules.
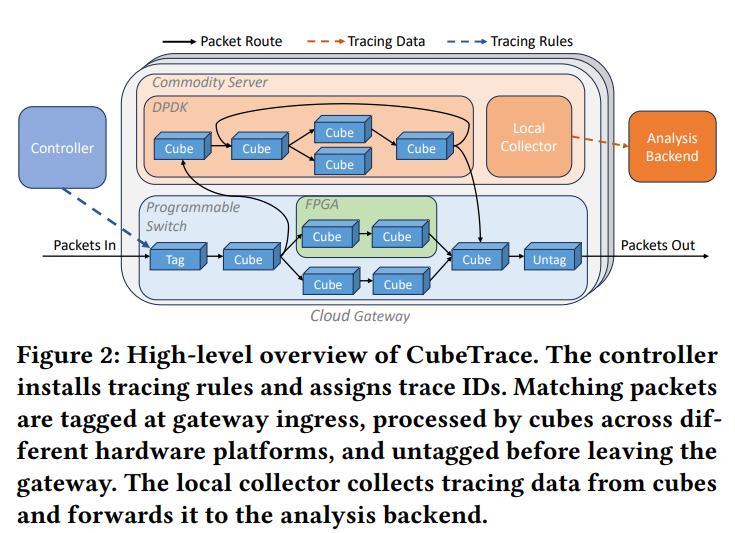
The overall workflow is as follows: the controller distributes tracing rules and trace IDs; packets are tagged at ingress; each cube locally aggregates counters and latency; the packet field is restored at egress; and the analysis backend collects statistics from the gateway nodes to reconstruct paths and localize anomalies over an ambiguity-free tracing graph (Figure 2).
Evaluation
The paper evaluates CubeTrace along three dimensions: whether the tracing graph is decodable, whether tracing overhead is sufficiently low, and whether the resulting diagnostics are useful.
-
Can ambiguity be removed from the tracing graph? The first production tracing graph contained 303 ambiguity cycles. Of these, 301 arose from the fully connected structure between seven load-balancing cubes and four forwarding cubes. Adding a single cube between the two stages immediately reduced the cycle count to two. The authors then added observation points between the ACL and the DPDK channels, producing a fully ambiguity-free graph. This experiment shows that ambiguity detection not only determines that a graph is undecodable but also identifies where additional instrumentation is needed.
-
Resource and latency overhead across heterogeneous data planes. The tracing logic on the programmable switch and FPGA executes in parallel with the original pipeline and adds no forwarding latency. On the switch, each stage consumes the minimum allocatable 1.25% of SRAM and one of four SALUs. The FPGA uses ten 32-bit counters, accounting for only about 0.02% of its register resources, and supports 250 Mpps—roughly five times the packet-processing capacity of a typical gateway node. Enabling CubeTrace in DPDK consumes about 2%–8% additional CPU cycles. Even in the most demanding case, where every 1280-byte packet matches a tracing rule, forwarding latency increases by only about 1%.
-
Communication cost of trace reporting. Mirroring every packet together with its tracing data requires about 1–30 MB for a single flow, roughly 200 MB for all traffic between a server pair, and more than 1 GB for all traffic sent to one receiver. With per-flow aggregation, even the last scenario requires no more than 1 MB. CubeTrace further supports flexible aggregation at the gateway-node granularity and reduces the upload volume to less than 20 KB when fewer than ten gateway nodes are involved—several orders of magnitude below the per-packet approach.
-
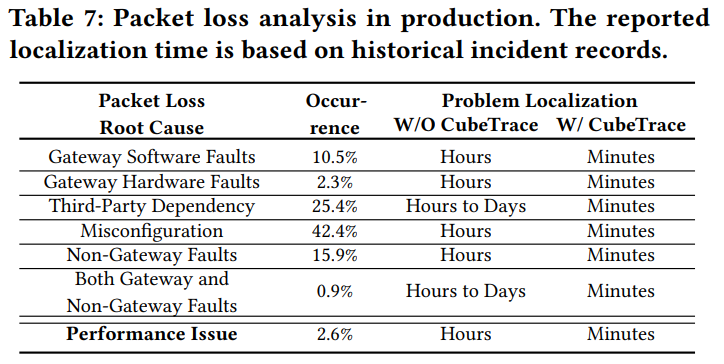
Production incident localization. Table 7 summarizes real incidents involving gateway software faults, hardware faults, third-party dependencies, misconfigurations, and non-gateway faults. Without CubeTrace, localization usually takes hours and can take days for complex incidents. With CubeTrace, each type of incident can be narrowed down to a specific path and cube within minutes or, at most, within an hour.
-
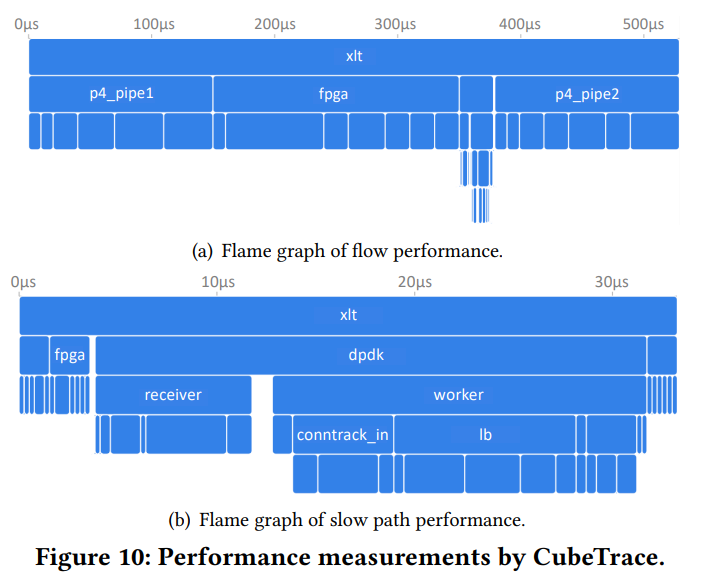
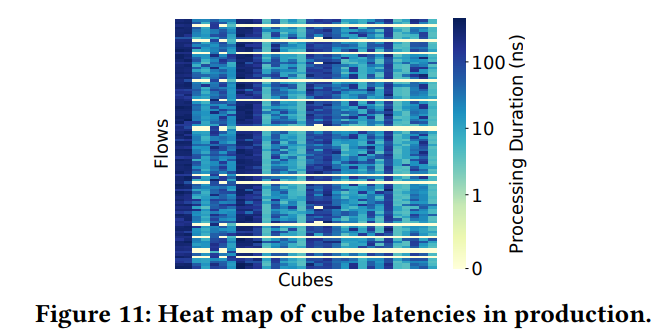
Performance analysis. Figure 10 shows that the fast path of a flow spends most of its time in the programmable switch and FPGA, whereas DPDK accounts for about 80% of the first packet’s slow-path processing time. Figure 11 uses a heat map of cube latencies for 100 production flows to expose differences in both path and processing time. CubeTrace also captured tail-latency anomalies in which processing time rose from approximately 50 ns to 5 ms, helping engineers identify inefficient segmentation reassembly and hash-based routing-table lookups.
Q1: Are the flows mentioned in the presentation typically defined as five tuples?
A1: Not necessarily. A flow can be defined with arbitrary granularity. It can refer to all packets from one source, all packets to one destination, or be as fine-grained as a five tuple. The key is attaching a trace ID to all packets.
Q2: Do you need to add more trace IDs and introduce more dimensions, or do you adopt one broad flow definition with multiple fields and extract information from it?
A2: It depends on requirements. For tracing scenarios requiring traffic replay, we generally only trace the traffic used for replay instead of all traffic all the time. The strategy varies across different use cases.
Personal Thoughts
What I find most instructive about CubeTrace is that it does not insist on reproducing the full capabilities of CPU tracing across all three hardware platforms. Instead, it begins with their smallest common set of capabilities—packet tagging, counters, and limited latency statistics—and defines a unified abstraction around them. It gives up per-packet ordering and complete causal information in exchange for cross-hardware consistency and production deployability. The graph ambiguity test also states precisely when aggregated data is sufficient for path reconstruction, making this trade-off more rigorous than one based solely on operational intuition.
The limitations arise from the same trade-off. CubeTrace generally cannot diagnose intermittent packet reordering, reconstruct a complete TCP handshake, or recover the exact execution history of every packet in a large flow; these tasks still require per-packet tracing or endpoint tools. FPGA latency is derived mainly from offline profiling and may become less accurate under heavier runtime contention. Additional cubes also consume hardware resources and increase maintenance complexity. Automatically finding a minimum observation-point set and continuously checking graph decodability after program or topology changes would make the system easier to operate over the long term.