Title: m3: Accurate Flow-Level Performance Estimation using Machine Learning
Authors: Chenning Li*, Arash Nasr-Esfahany*, Kimia Noorbakhsh4, Mohammad Alizadeh (MIT CSAIL), Kevin Zhao, Thomas Anderson (University of Washington), Prateesh Goyal (Microsoft Research)
Scribe: Ziyi Wang (Xiamen University)
Introduction
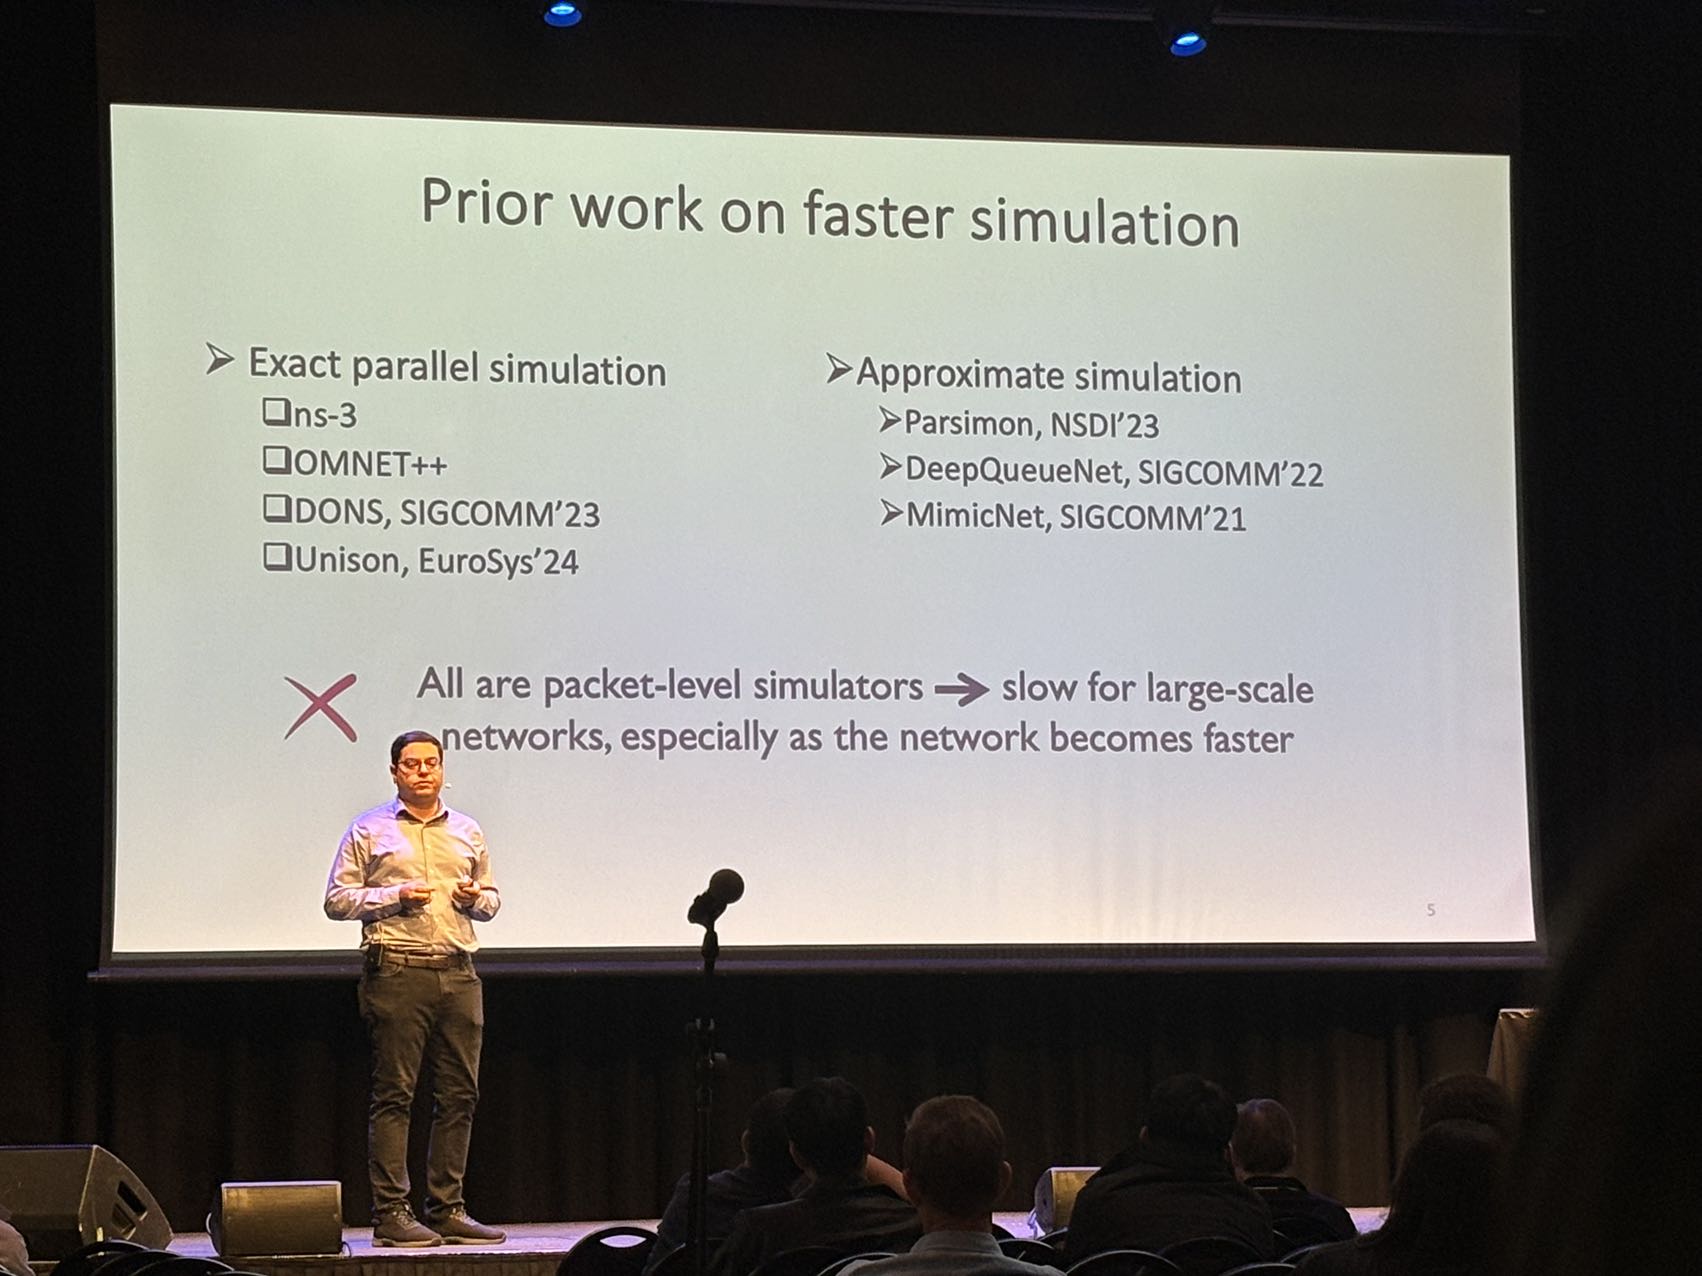
Data center network operators need to accurately estimate network performance metrics, such as Flow Completion Time (FCT), to guide network configuration, optimize resource utilization, and enhance user experience. However, existing methods either rely on detailed packet-level simulations, which are accurate but extremely slow in large-scale networks or use simple approximation methods, which are fast but lack accuracy. As data centers continue to grow in scale, there is an urgent need for a new method that can maintain high accuracy while completing estimations within a reasonable timeframe.
Key idea and contribution:
The key idea of M3 is to enhance the speed and accuracy of performance prediction through high-level network simulation. Instead of detailed packet-level event simulation, M3 abstracts network simulation into aggregated statistics (such as tail latency and utilization), which significantly speeds up the simulation. M3 decomposes the network simulation into independent path-level simulations, focusing on the traffic along specific paths, thus simplifying the simulation process. Additionally, it integrates machine learning with feature maps generated by FlowSim to quickly estimate network performance metrics. FlowSim, as a flow-level simulator, generates compressed feature maps that are used to train machine learning models, enabling M3 to accurately and swiftly predict network performance.
Evaluation
By evaluating with production workloads and actual network topologies using ns-3, m3 demonstrates higher simulation speed and accuracy compared to Parsimon. For instance, in a fat-tree topology with 32 racks and 256 hosts, m3’s simulation time is one-sixth that of Parsimon, with a significantly reduced estimation error. Moreover, in a larger topology with 384 racks and 6144 hosts, m3 completes the simulation in 54 seconds, whereas Parsimon takes 2 minutes and 8 seconds, and ns-3 requires 18.5 hours.
With this design, m3 achieves efficient and accurate network performance estimation, providing a powerful tool for the configuration and optimization of data center networks.
Q1:
These path decompositions look very similar to some of the work Frank Kelly did in simplifying loop approximations. Are you familiar with this? Does it provide any insight into when this approximation is effective? Why are you particularly focused on these?
A1:
I think it’s a bit of both. In fact, it’s like all these product form mixed models. There is a lot of multipath traffic in the workloads of these data centers, which seems to naturally apply to this approximation method. Our team’s previous work also used an extreme independent link simulation, and even in this case, this approximation is relevant. I think theoretically, this method is feasible.
Q2:
On the Internet, do you think this method is suitable for studying or comparing different congestion control algorithms?
A2:
That’s a good question. If you want to explore design space, compare various congestion control protocols, or adjust many parameters, M3 provides a very fast way to get trends and determine which aspects may be worth further in-depth simulation. This is part of the work progress we are researching. If you have a model that can quickly predict performance, you can use it in the inner loop of the optimization process, which brings a series of challenges in handling approximation errors and model errors, but this is a very interesting direction.
Q3:
Regarding the issue of workload feature implementation. When generating training data, what workload features do I need to understand?
A3:
These workload features, such as flow completion time-related features, are very natural because they are basically the flow completion times you observe in flow-level simulations, which is exactly what you want to predict, just with some deviation. More generally, the completion times of different sized flows provide a profile of network latency and throughput characteristics, so it makes sense. Smaller flow ranges correspond to the latency characteristics of the network, while larger flow ranges correspond to throughput characteristics. This is a complex way of expressing network latency and throughput characteristics under different workloads. I think this may be a fairly general feature, but more work is needed to try to predict other types of performance statistics.
Personal thoughts
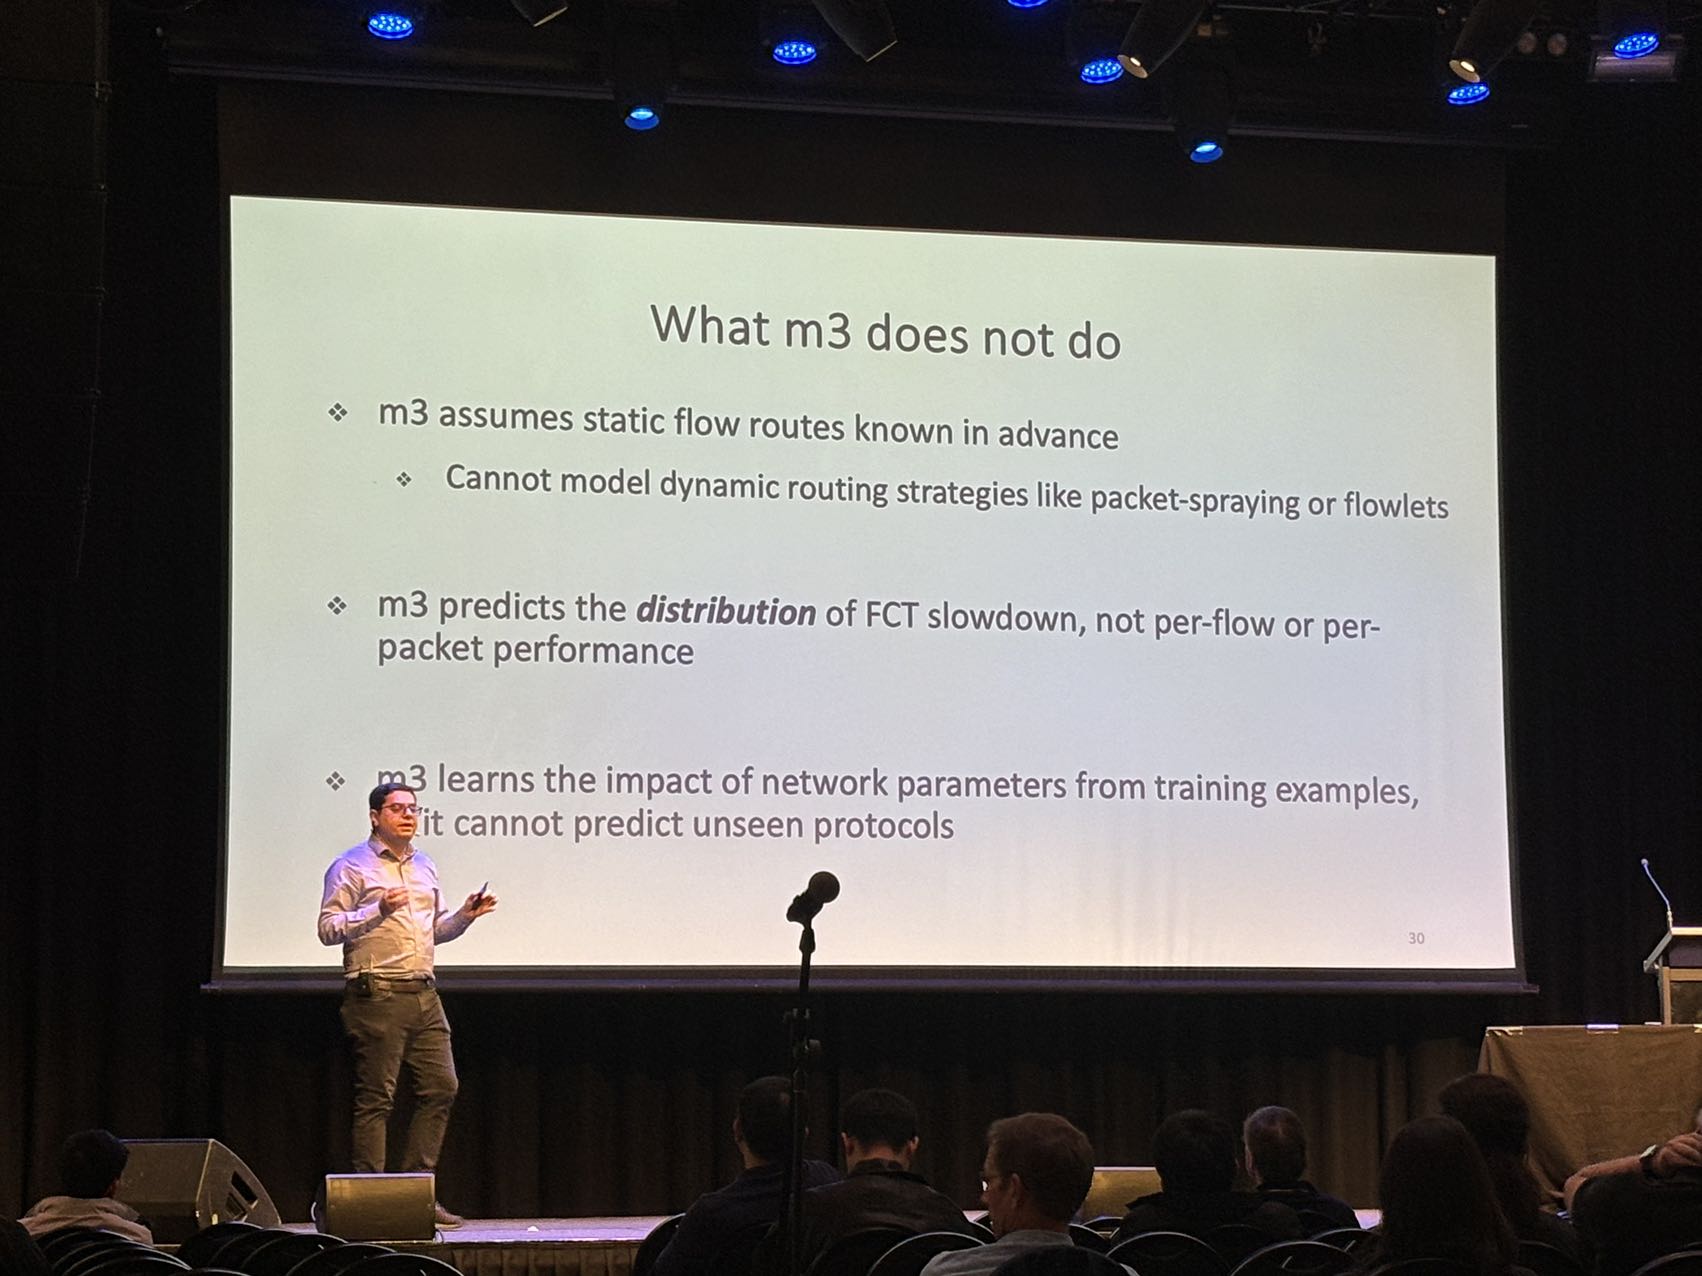
M3 applies machine learning to handle complex path-level simulations while maintaining high accuracy. However, there are some unresolved issues in the paper. For example, the capability of m3 to handle dynamic routing strategies and multipath traffic is not clearly addressed. Additionally, while m3 performs excellently in FCT estimation, its applicability to other performance metrics still needs to be validated.